Initiating Coverage | Logistics
February 21, 2015
Transport Corporation of India
BUY
CMP
`250
Economic revival to spur growth
Target Price
`293
Investment Arguments
Investment Period
12 Months
Top-line growth to accelerate to 15% CAGR over FY2014-17E on economic
Stock Info
revival; eventual GST implementation would provide further boost: We expect
Sector
Logistics
Transport Corporation of India (TCIL) to report a healthy top-line growth ~15%
Market Cap (` cr)
1,890
CAGR over FY2014-17E on the back of revival in the Indian economy. Among
TCIL’s four business segments, we expect (a) Express segment to report ~17%
Net Debt (` cr)
285
CAGR. TCIL is also be well-placed to garner e-commerce business, as bulkier
Beta
1.6
categories like furniture, white goods see more traction in online sales. (b) Supply
52 Week High / Low
299 / 88
Chain Solution segment to report ~21% CAGR, owing to recovery in the
Avg. Daily Volume
15,533
automobile sector, growth in E-commerce fulfillment hubs, as well `as new
Face Value (`)
2
customer wins due to increasing outsourcing of supply chain in other sectors like
BSE Sensex
29,231
FMCG, chemicals, cold storage, etc. especially once GST kicks in. The other two
Nifty
8,834
segments, viz. Seaways and Freight, are also likely to benefit from economic
Reuters Code
TCIL.BO
revival and expected to report ~9% CAGR.
Bloomberg Code
TRPC@IN
Stepped-up capex spending in higher margin businesses to aid overall earnings
growth trajectory: As the demand environment improves, we expect margins to
Shareholding Pattern (%)
improve across segments for TCIL. Moreover, we expect the company to increase
Promoters
69.1
focus on higher margin businesses like XPS and Supply Chain Solution. As a
MF / Banks / Indian Fls
0.8
result, the revenue contribution of these businesses is expected to increase from
FII / NRIs / OCBs
2.3
~56% in FY2014 to ~62% in FY2017E, with the company having aggressive
Indian Public / Others
27.9
expansion plans in these businesses (Rs500cr capex over FY2015-17E). As a
result, we expect overall margins to improve from 7.6% in FY2014E to 9.0% in
Abs. (%)
3m 1yr
3yr
FY2017E, driving 25% CAGR in net profits over the same period.
Sensex
4.2
42.3
59.8
Outlook and Valuation: TCIL benefits from its pan-India scale (which gives it
TCIL
(3.9) 182.5
247.3
competitive advantage in higher margin segments of the logistics industry) as well
as from its asset-light business model (which cushions its profitability in cyclical
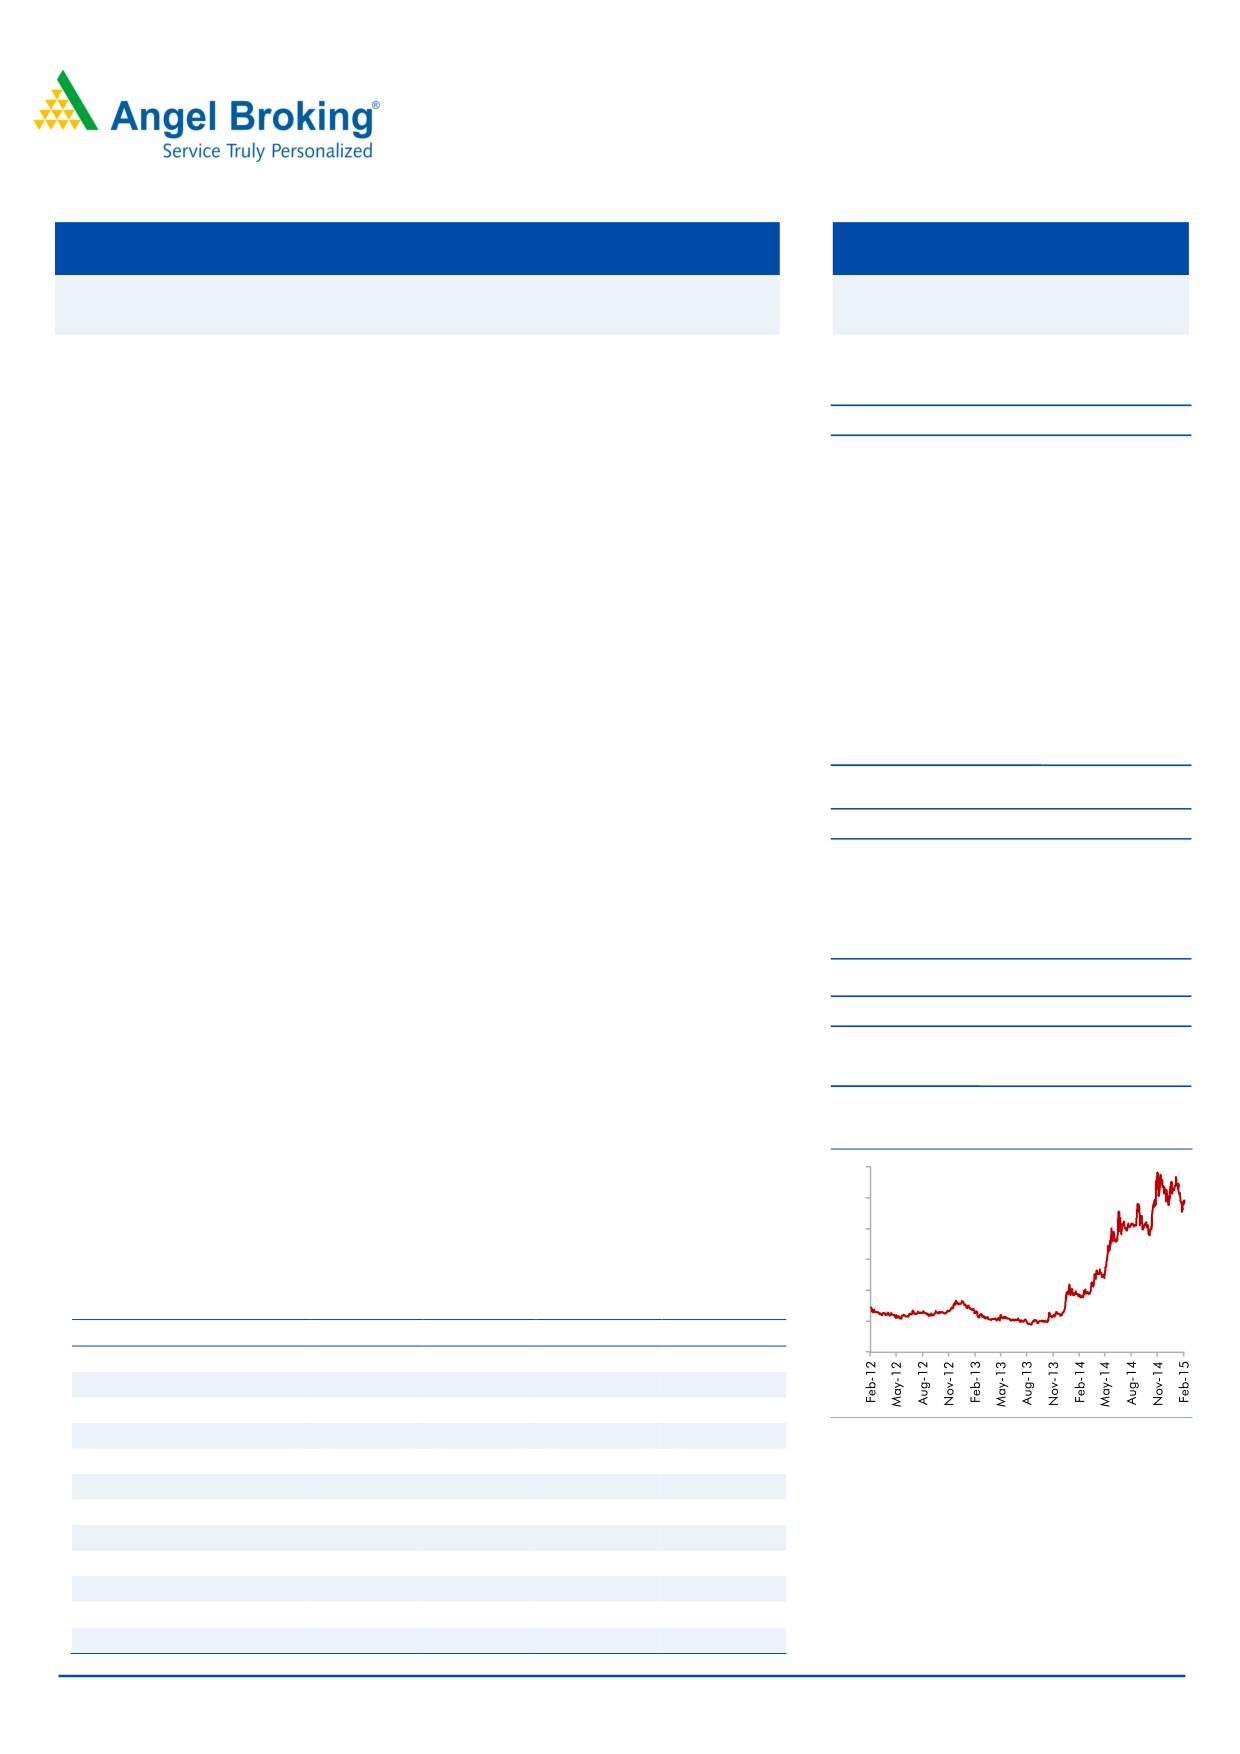
3-year price chart
downturns and gives it an attractive ROE profile). The company is well-placed to
300
be a key beneficiary once GST is implemented, when corporates will need reliable
250
pan-india logistics players to manage their hub-and-spoke supply chains. At the
200
CMP, TCIL trades at a P/E of 13.7x FY2017E. We initiate with a Buy and target
150
price of `293 (16x FY2017E EPS), indicating an upside of ~17%.
100
Key financials
50
Y/E March (` cr)
FY2014
FY2015E
FY2016E
FY2017E
0
Net sales
2,228
2,468
2,830
3,350
% chg
4.5
10.8
14.6
18.4
Net profit
72
87
109
138
% chg
3.0
22.1
24.3
27.4
Source: Company, Angel Research
EBITDA margin (%)
7.6
8.0
8.8
9.0
EPS (`)
9.5
11.6
14.4
18.3
P/E (x)
26.4
21.6
17.4
13.7
P/BV (x)
3.9
3.0
2.7
2.3
RoE (%)
14.6
14.1
15.4
17.1
RoCE (%)
14.9
14.2
16.4
18.0
Amarjeet S Maurya
EV/Sales (x)
1.0
0.9
0.8
0.7
022-39357800 Ext: 6831
EV/EBITDA (x)
12.8
10.9
8.9
7.6
Source: Company, Angel Research, Note: CMP as of February 20, 2015
Please refer to important disclosures at the end of this report
1
Transport Corporation of India | Initiating Coverage
Investment Arguments
E-commerce industry to drive growth of XPS division
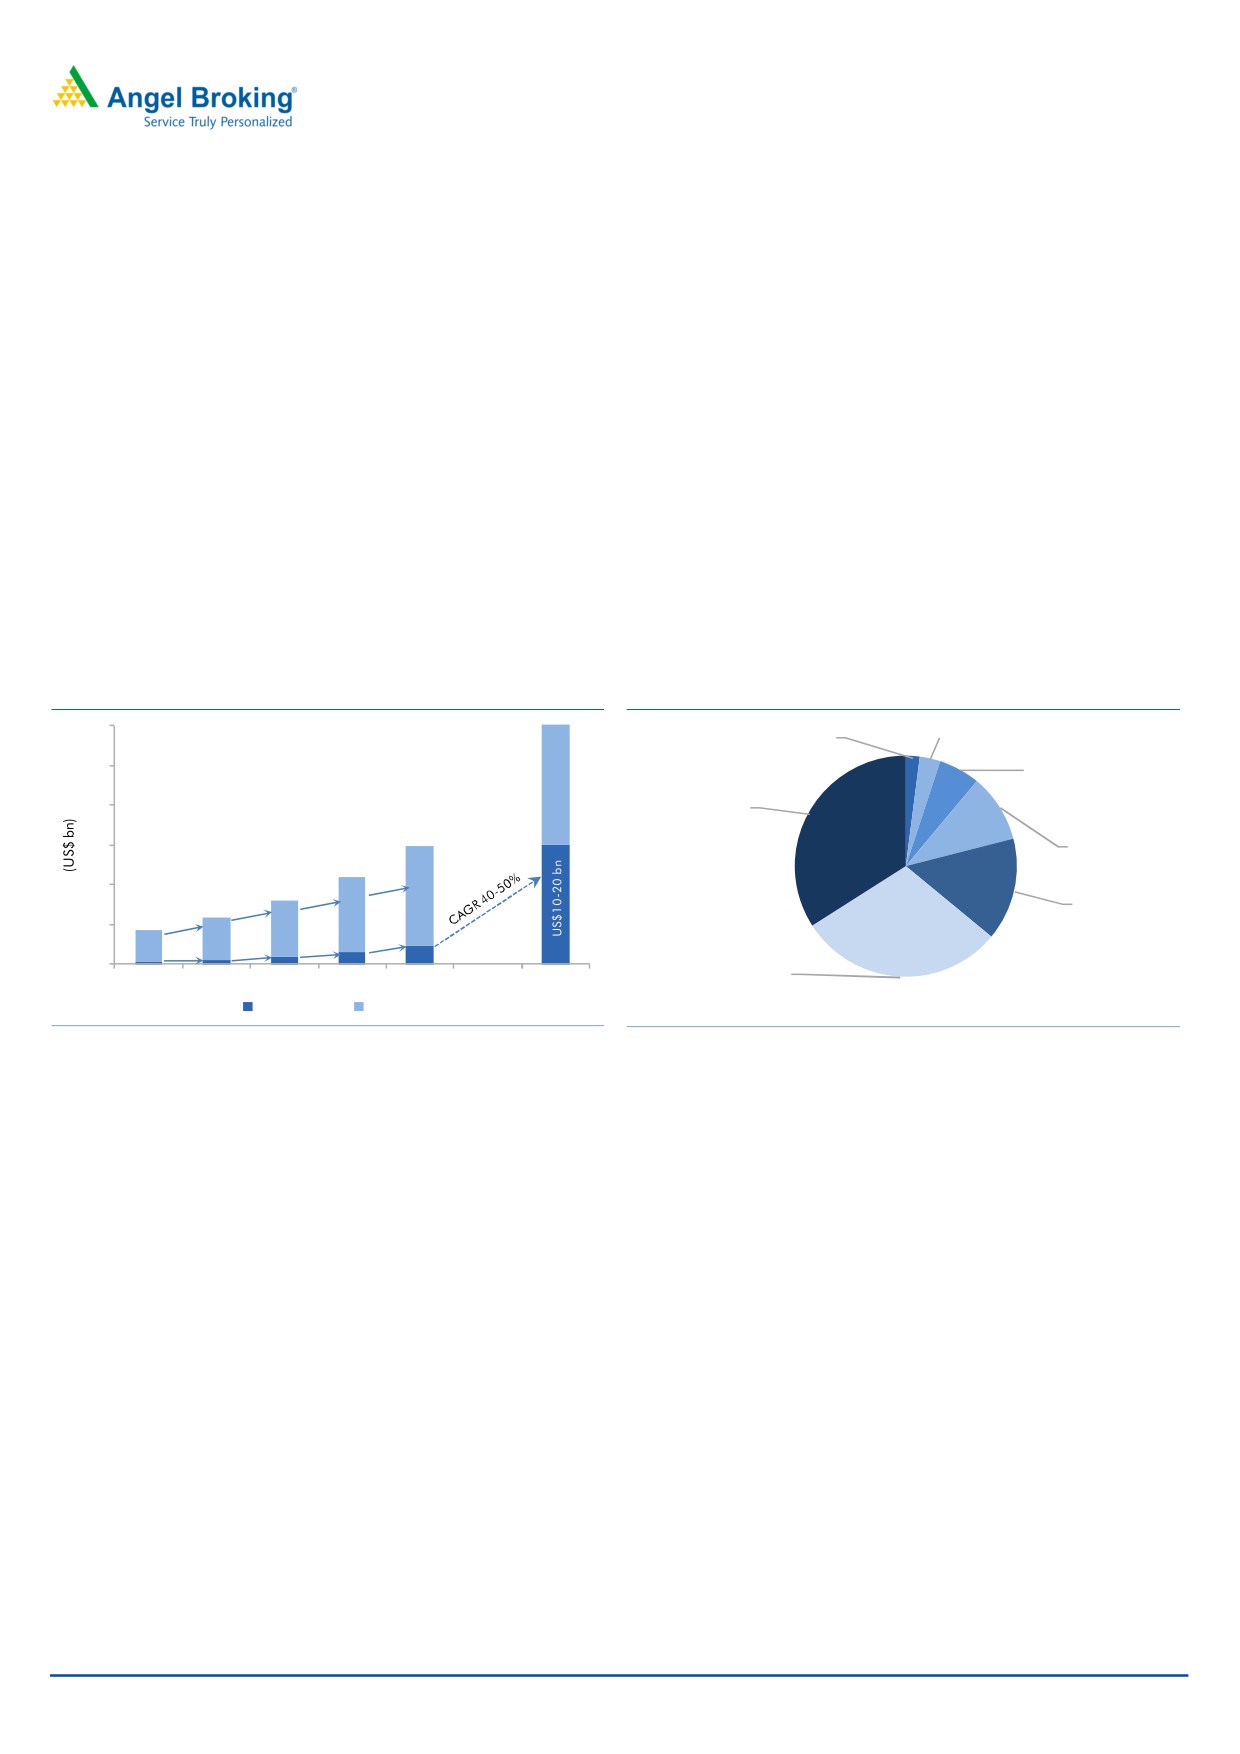
According to ASSOCHAM and PWC, the Indian e-commerce industry’s market size
is less than 10% of USA and China’s market size (US$150bn) of ecommerce.
Indian e-commerce industry’s market
However, over 2009-13, the e-commerce sector in India has grown at a CAGR of
size is less than 10% of USA and China
almost 35% to an estimated US$12.6bn on back of rising internet and mobile
market size (US$ 150bn) of ecommerce.
phone penetration. In the domestic e-commerce industry,
~70% of the
transactions are accounted by online ticketing and ~10% by e-retailing and online
market place. However, e-retail in both its forms, ie online retail and market place,
has become the fastest-growing segment, increasing its share from 10% in 2009 to
an estimated 18% in 2013. As per an industry report, going forward, the e-retail
market is expected to grow to around US$10-20bn by 2017-20 on account of
increase in consumer-led purchases in durables and electronics, apparels and
accessories etc.
Exhibit 1: Growth in e-commerce & e-tailing (e-retail)
Exhibit 2: Product mix in e-tailing
30
Baby products,
Healthcare ,
2%
3%
Home and
25
furnishing , 6%
20
Electronics ,
34%
Beauty &
15
personal , 10%
29%
10
32%
12.6
Books , 15%
29%
37%
9.5
5
7.0
5.3
53%
3.8
58%
53%
57%
1.0
1.5
2.3
0.4
0.6
0
Apparels &
2009
2010
2011
2012
2013
2017-20
accessories ,
E-Commerce E-Tailing
30%
Source: Crisil, IAMAI, PwC analysis and Industry experts
Source: Internet and Mobile Association of India research
Robust growth in e-retailing over the last few years is aiding growth for logistics
companies. Going forward, we believe that growth in e-retail would trigger growth
TCIL’s XPS division (express delivery of
of the express business of logistics companies. TCIL’s XPS division (express delivery
goods) accounted for ~29% of FY14
of goods) accounted for ~29% of the company’s FY2014 revenues. In this
revenues.
segment, the company’s focus is on both B2B and B2C (both being a part of
e-commerce). TCIL’s 50% revenue comes from apparels, pharma and electronic
goods. Currently, TCIL is generating negligible revenue from ecommerce; the
revenue from ecommerce as a proportion of total revenue is very low. The
companies is also into movement of large white goods such as televisions,
refrigerators etc, which are still not preferred to be bought from e-commerce
platforms by customers. In our view, growing customer preference for buying large
white goods online will drive growth for the company in the long term. Further, the
company also provides services towards moving consumer durables and electronic
equipment from facilities of the OEMs to warehouses of e-tailing companies. TCI
also operates fulfillment centres for e-tailing companies and has plans to scale up
these services going forward.
February 21, 2015
2
Transport Corporation of India | Initiating Coverage
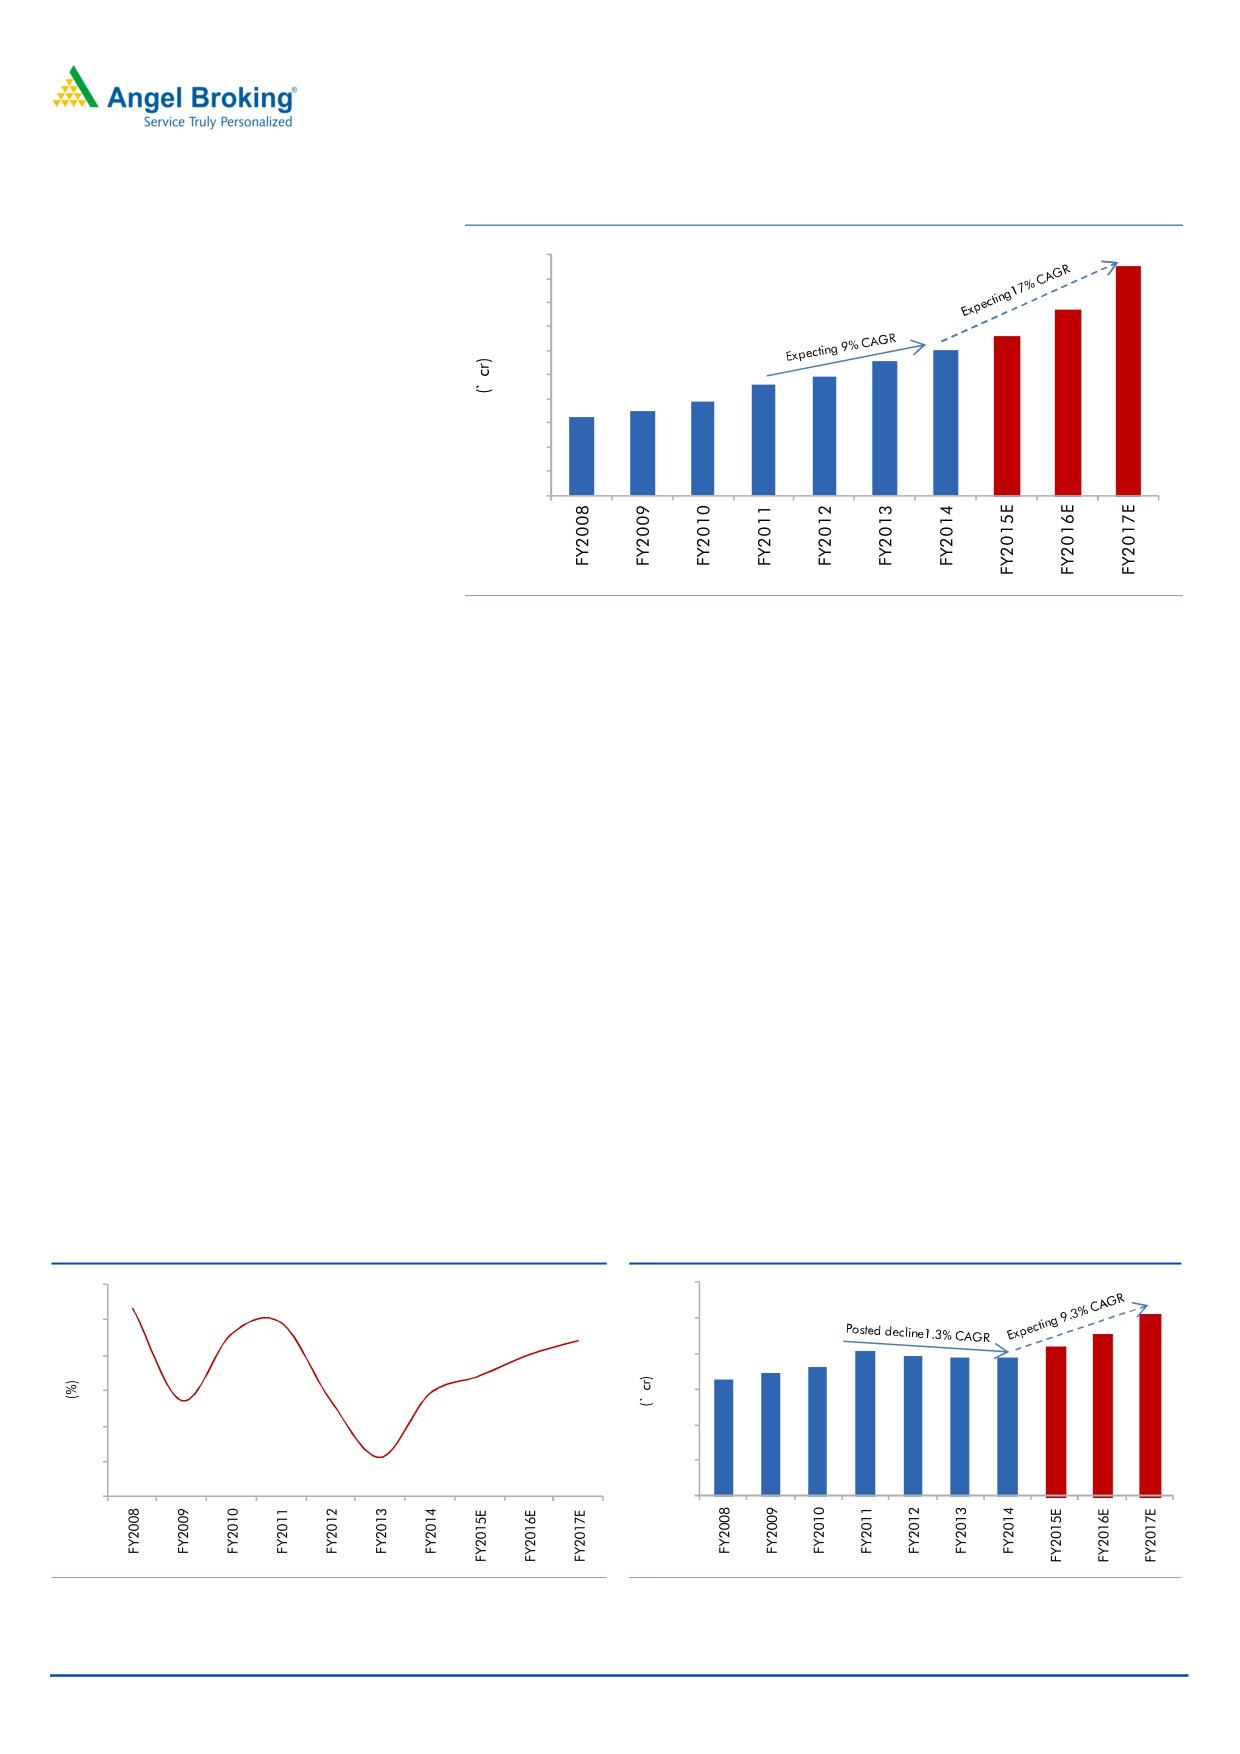
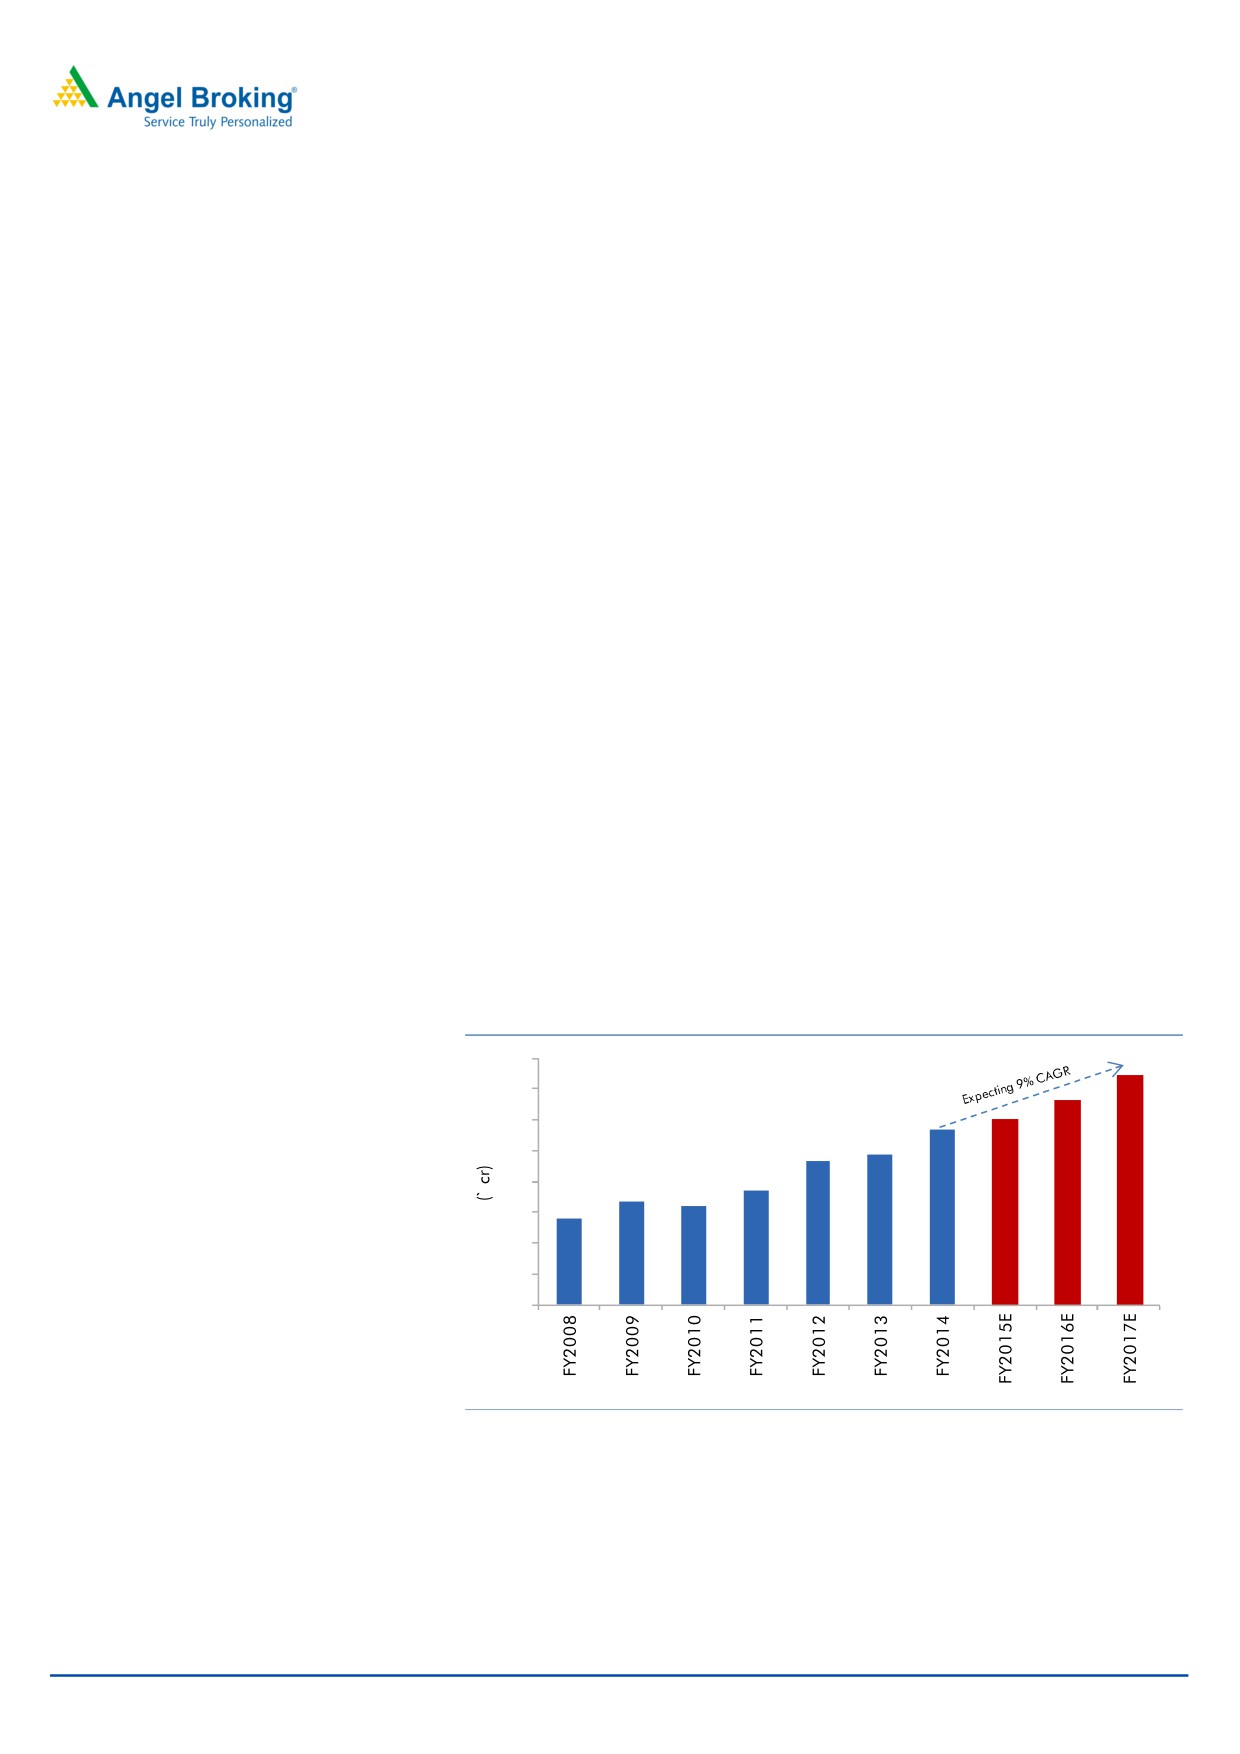
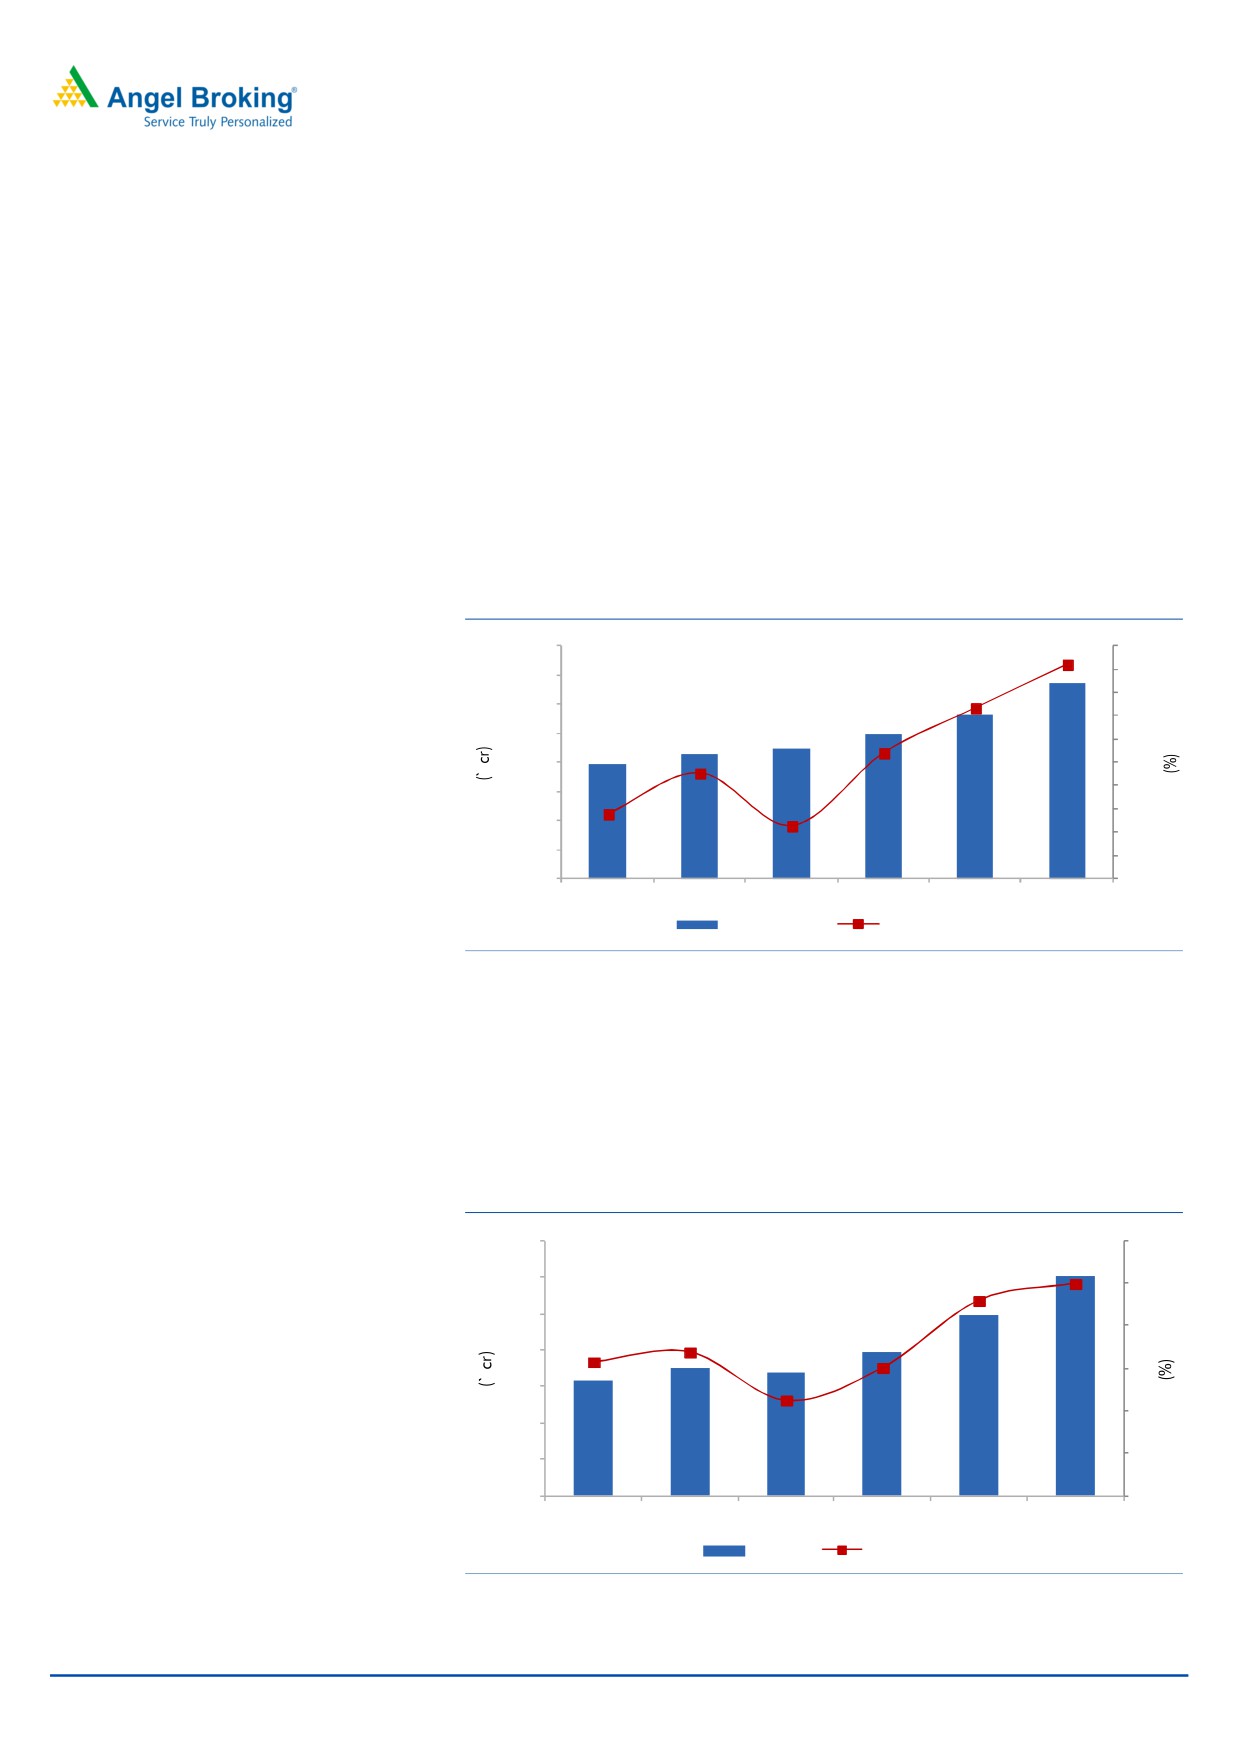
Exhibit 3: Projected Revenue growth trend for XPS Division
1,000
In XPS division, we expect the company
900
800
to report a strong ~17% CAGR over
700
FY2014-17E
600
500
400
300
200
100
-
Source: Company, Angel Research
Hence, considering growth in 9MFY2015 sales numbers, improvement in
economy, strong growth in e-commerce segment, and capacity expansion, we
expect the company to report a strong ~17% CAGR over FY2014-17E.
Economic revival to boost the growth for Freight division
In the freight segment, the company is one of India’s premier organized freight
services providers with a pan India presence. The company has around 2,400
trucks and trailers, both owned and leased, which provide freight movement
services on a daily basis. It has a strong backing in terms of its extensive and
strategically located branch network and trained work force. The Freight division
contributes by ~38% (FY2014) to the total revenue. TCIL’s Freight division
(Transport division) has been underperforming in the last few years (it reported a
de-growth of ~1% [CAGR] over FY2011-14) due to slowdown in GDP growth,
reflecting slowdown in overall industrial activity in the country. In 9MFY2015, the
Freights division showed recovery in revenue growth, ie it posted a revenue growth
of ~5% yoy (mainly in the previous quarter), owing to an improving economic
scenario. Further, the Management is also confident of posting a better
performance, than in the previous few quarters, in the coming financial years.
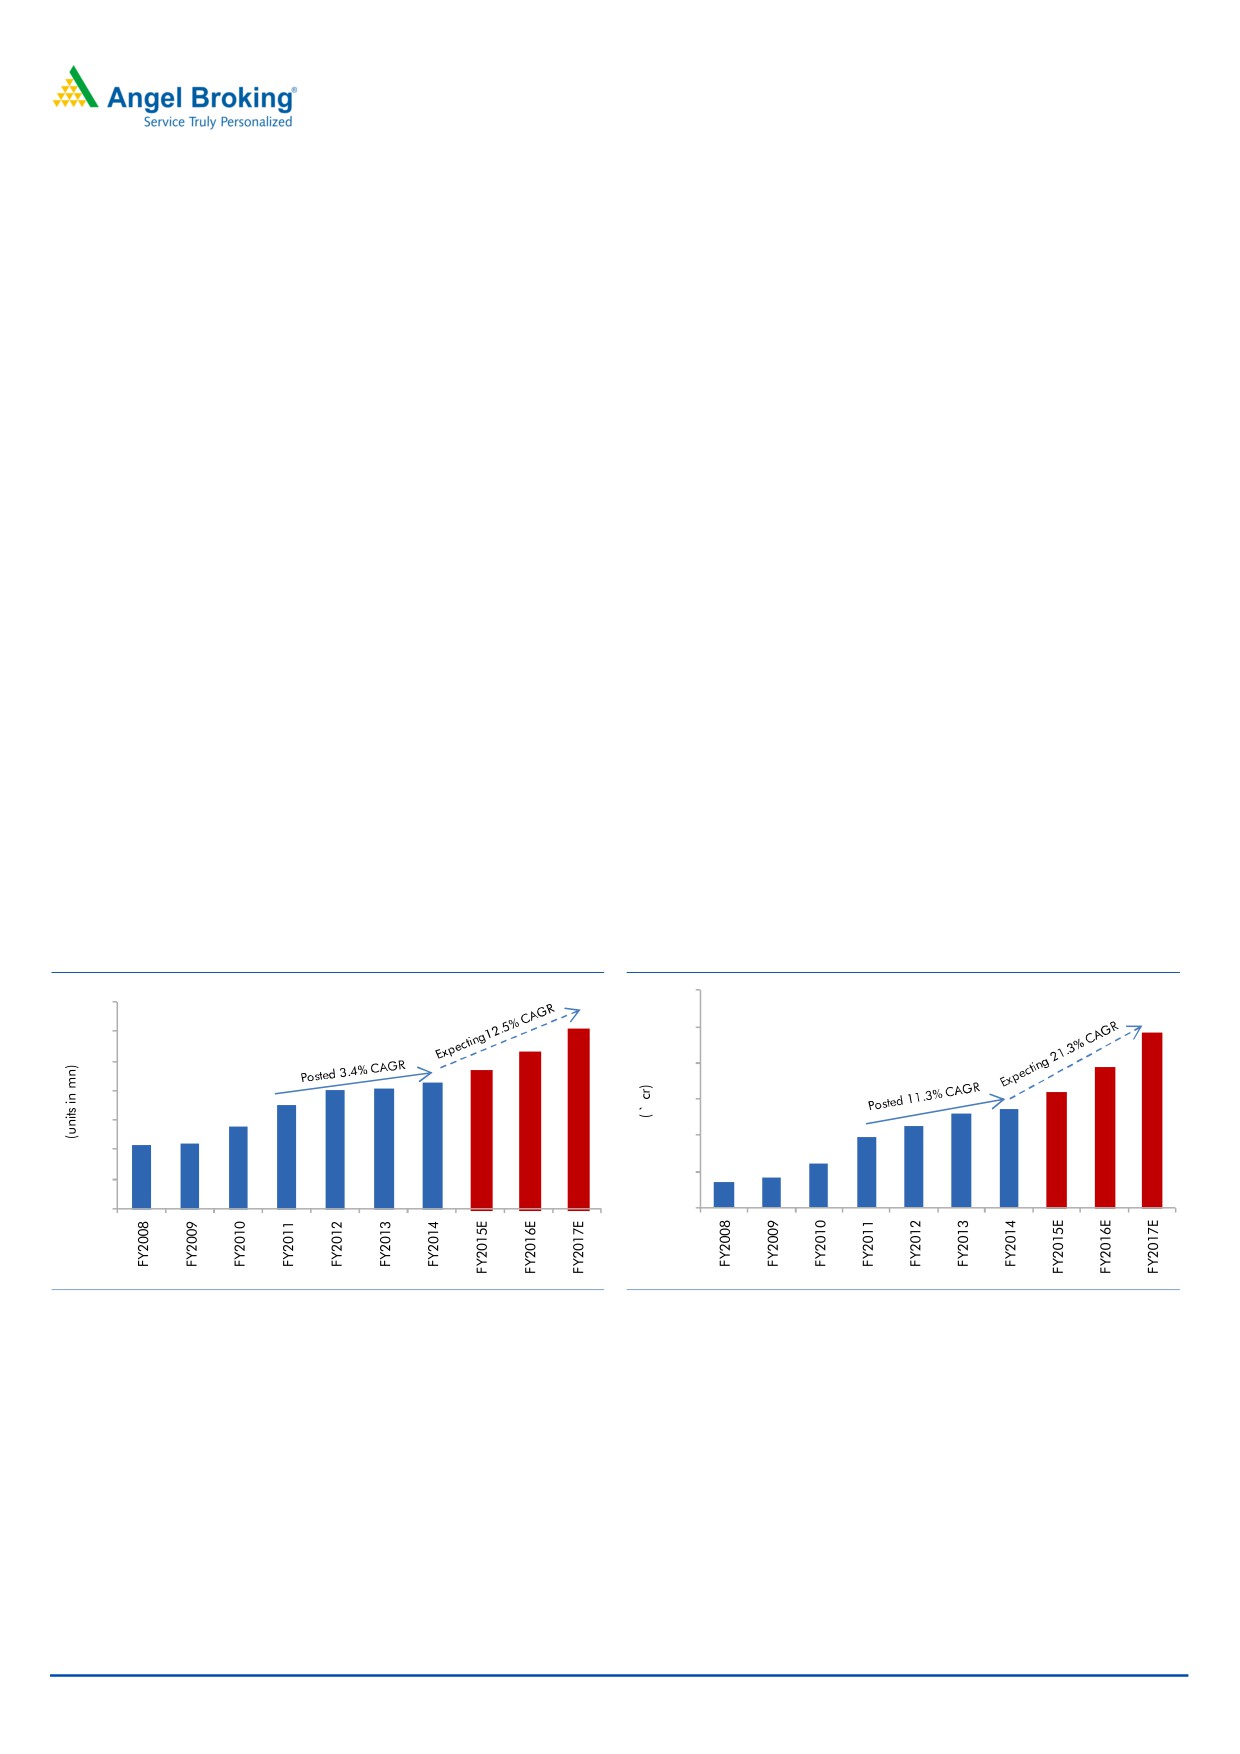
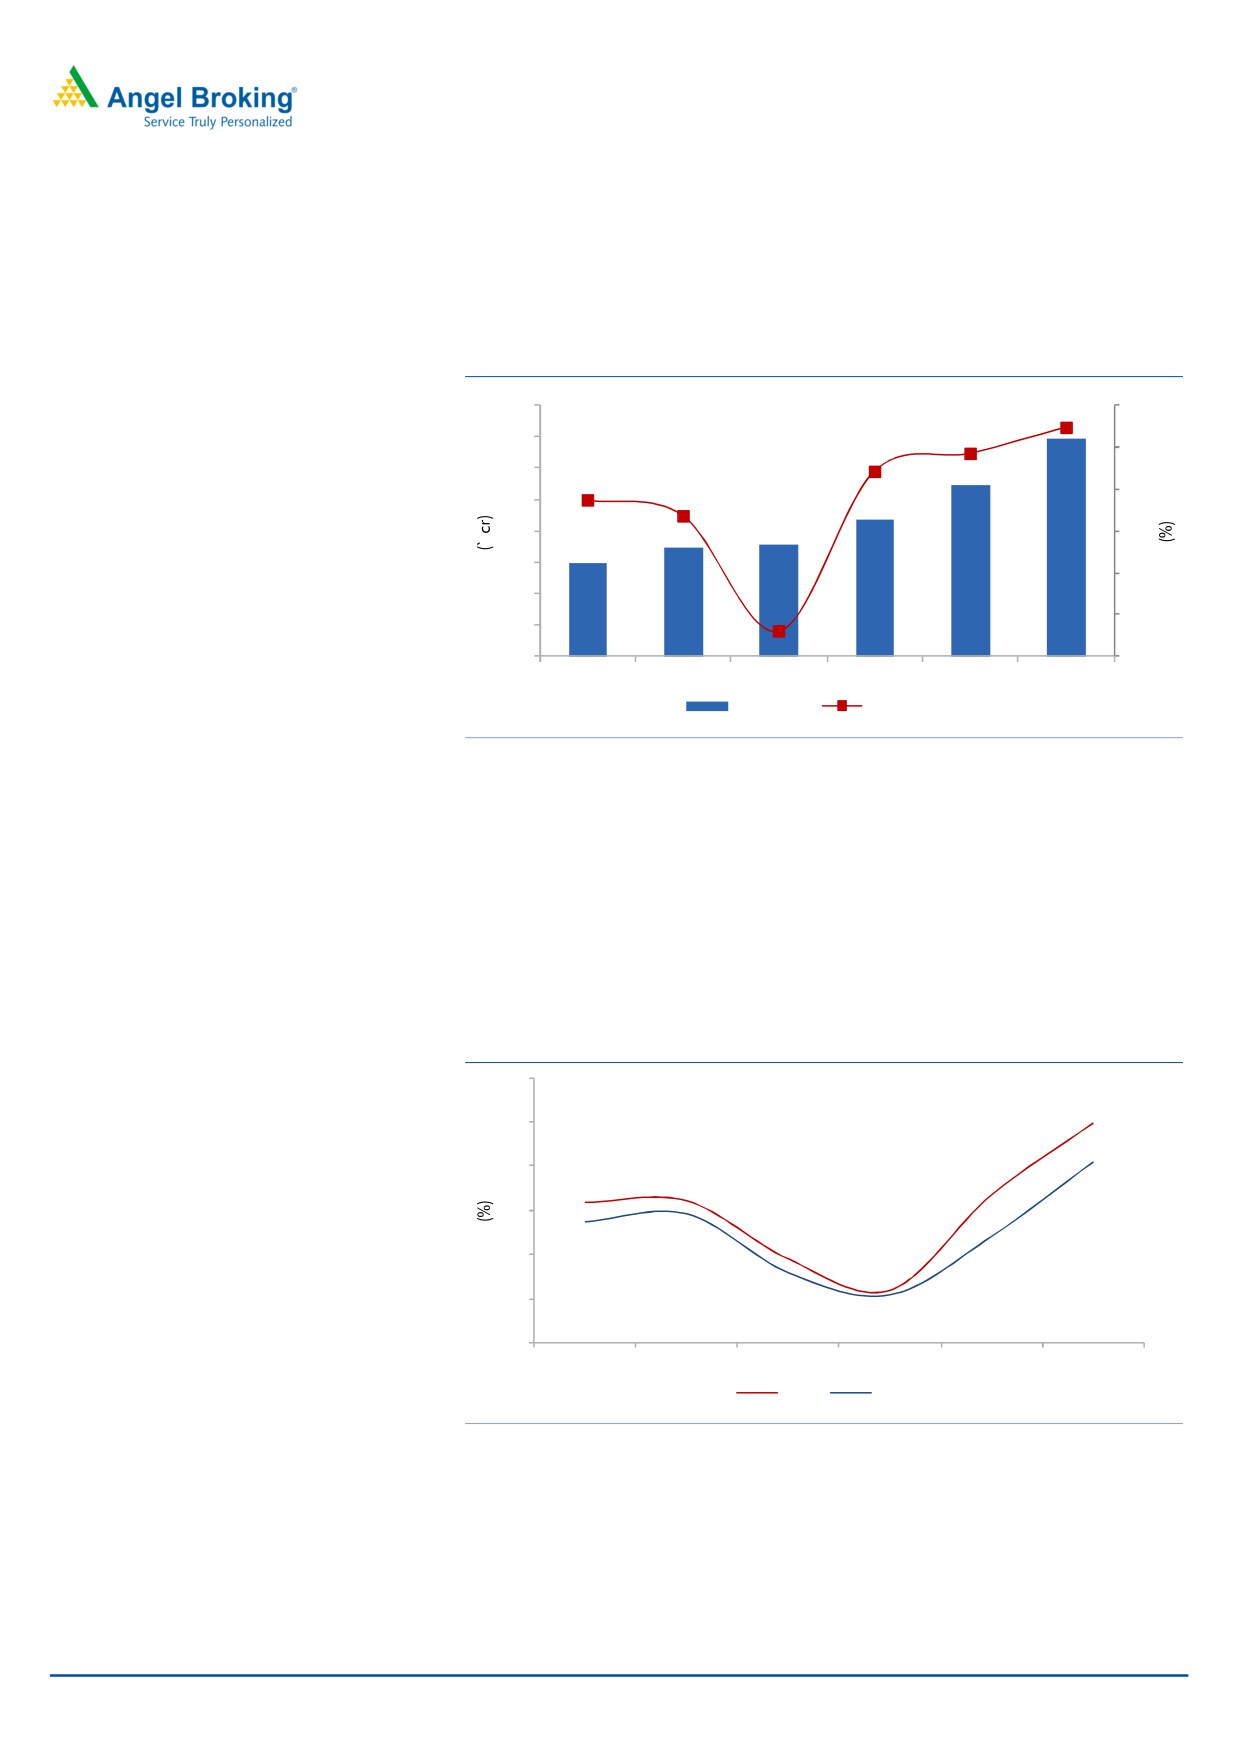
Exhibit 4: GDP growth expected to bounce back
Exhibit 5: Projected Revenue growth trend for Freight division
10
1,200
9
1,000
8
800
7
600
6
400
5
200
4
-
Source: Company, Angel Research
Source: Company, Angel Research
February 21, 2015
3
Transport Corporation of India | Initiating Coverage
Considering momentum in policy reforms, fall in inflation, and anticipation of
further rate cuts by the Reserve Bank of India (RBI), we believe that the investment
cycle and commercial activities in the country will get a boost. This would lead to
We expect the Freight division to report
improvement in GDP growth in FY2016 and FY2017, which in turn will assist
a healthy ~9% CAGR over FY2014-17E
overall growth in the Freight division (Transport segment). Also, industry is
expecting GST implementation in FY2016 which will further increase the growth
prospects of the industry, and this will directly benefit the company with it being a
dominant player in the industry. Considering the overall improvement in demand
for the Freight division in 9MFY2015, increasing numbers of trucks in operation,
and improving economy activities, we expect the Freights division to report a
healthy ~9% CAGR over FY2014-17E.
Recovery in automobile industry to aid Supply Chain Solution
(SCS) division
The automobile industry’s performance in the past two consecutive years (FY2013
and FY2014) has been disappointing. But in 9MFY2015, the 2W industry has
~75% of Supply Chain Solution
reported a strong growth of ~13% due to recovery in domestic and export
division’s
business
comes from
markets, and passenger vehicle (PV)s have also shown an ~4% yoy growth.
Automobile sector and balance from
Further, the commercial vehicle (CV) segment has also shown some improvement
FMCG
(de-growth of ~4% yoy for 9MFY2015 as against a ~19% yoy de-growth for
FY2014) on back of improvement in sales volumes in medium and heavy
commercial vehicle (MHCV) and light commercial vehicle (LCV) segments. We
expect growth momentum to continue and expect the Indian automobile industry to
report a healthy 12.5% CAGR over FY2014-17E.
Exhibit 6: Expected revival in Automobile industry
Exhibit 7: Projected Revenue growth trend for SCS division
1,200
35
30
1,000
25
800
20
600
15
400
10
200
5
0
0
Source: SIAM, Angel Research
Source: Company, Angel Research
The Supply Chain Solution segment accounts for ~27% of total revenue (FY2014)
of TCIL. In this segment ~75% of the business comes from the automobile sector
TCIL’s marquee customers include
and the balance from the FMCG and other segments (marquee customers include
Maruti, GM, Tata Motors, Hero, Bajaj,
Maruti, GM, Tata Motors, Hero, Bajaj, Hindustan Unilever, Samsung, VW Group
Hindustan Unilever, Samsung, VW
etc). In the segment, the company caters to automobile OEMs; it provides supply
Group etc
chain solutions including inbound logistics, outbound logistics, and stocking
vehicles at the warehouses. Further, in this segment, the company has a JV with
Mitsui, Japan which manages the entire inbound logistics operations of Toyota
Kirloskar Motors India since 1999. The company owns 49% stake in this JV. Apart
February 21, 2015
4
Transport Corporation of India | Initiating Coverage
from this, the company also provides services in managing fulfillment centers and
back-end operations for e-commerce.
During FY2014, the division’s revenue was impacted due to slowdown in the
automobile industry. During 9MFY2014, TCIL has already reported a strong
growth of ~16% against ~4% growth for the same period last year, on back of
improvement in automobile industry sales volume numbers. Going forward, in our
view, we expect the automobile industry to report strong numbers on back of
improvement in the economy and expected interest rate cuts which would directly
benefit TCIL. Further, the company is also increasing capacity of its warehousing
facilities to cater to other verticals/sectors such as chemicals, temperature, etc.
Hence, considering this, we expect the Supply Chain Solution segment to report a
strong ~21% CAGR in revenue over FY2014-17E.
Capacity expansion of Seaways division to drive growth
TCI Seaways has well equipped ships in its fleet and caters to the coastal cargo
requirements for transporting container and bulk cargo from ports on the East
In Seaways division, we expect the
coast of the country. Recently, the company has increased its fleet from 4 ships in
company to report a strong revenue
FY2014 to 5 ships during 9MFY2015; also, it has replaced one ship. As a result
CAGR of ~9% over FY2014-17E
the total capacity has increased from ~17,000 DWT to ~27,800 DWT.
Further, the company is also planning to diversify outside Port Blair sector and
operate on the west coast as well. With the additional capacity of ships, the
company can generate `50-60cr revenue with an EBITDA margin of 10-15%,
translating into a healthy return ratio. Going forward, we expect the company to
report a strong ~9% CAGR in revenue over FY2014-17E.
Exhibit 8: Projected Revenue growth trend for Seaways division
160
140
120
100
80
60
40
20
0
Source: Company, Angel Research
February 21, 2015
5
Transport Corporation of India | Initiating Coverage
GST implementation to benefit the logistics sector
India’s duty and taxation system is very complex and expensive due to 29 states
and seven union territories which resulted into burden on intra-India trade. Indian
duty and tax structure differ from city to city, thus creating headwinds for creation
of national networks. We believe that the introduction of the Goods and Services
Tax (GST) would benefit the logistics sector. However, we are expecting
implementation of GST only by CY2016. In our view, TCIL over the years has
increased its presence across the country. In a scenario, where GST gets rolled-out,
we expect TCIL to be one of the few pan-India based Logistics players to get
benefitted from any such development.
Stepped-up capex spending in higher margin business to aid
overall earnings growth trajectory
38% of TCIL’s revenue comes from the Freights division, which is a low margin
business (3-5% margin on EBITDA level). Margins are low with the business being
mature and fragmented. Entry barriers are low owing to it not being a capital
intensive business. We expect the revenue contribution of the Freight division to
We expect the company’s higher
come from ~38% in FY2014 to ~33% in FY2017E with the company’s lower focus
margin businesses ie XPS and Supply
on the business. Going forward, we expect the company’s higher margin
Chain Solution to increase their revenue
businesses ie XPS (8-10% margin on EBITDA level) and Supply Chain Solution
contribution from ~56% in FY2014 to
(10-12% margin on EBIDTA level) to increase their revenue contribution from
~62% in FY2017E
~56% in FY2014 to ~62% in FY2017E, led by aggressive expansion plans in
these businesses.
Exhibit 9: Capital Expenditure Plan for the period
(` cr)
FY2007-14
FY2015-17
9MFY2015
Hub Centers & Small warehouses
219
280
40
The company spending
~76% of
Wind power
9
-
-
capex for XPS and Supply chain
Ships & Containers
74
118
70
Solution businesses
Trucks & Cars
220
88
15
Others
65
14
5
Total
586
500
130
Source: Company, Angel Research
We expect the XPS business to perform better on back of improvement in economy
and increase in penetration of e-commerce. The Supply Chain Solution business is
also expected to do well and achieve strong growth due to recovery in Indian
automobile industry. Also, in this business, the company is expected to add new
clients in the FMCG, chemicals, temperature and other segments and expect the
business to benefit from the implementation of the GST. Also, the company would
be incurring significant capex towards building warehouses, which would drive
growth.
February 21, 2015
6
Transport Corporation of India | Initiating Coverage
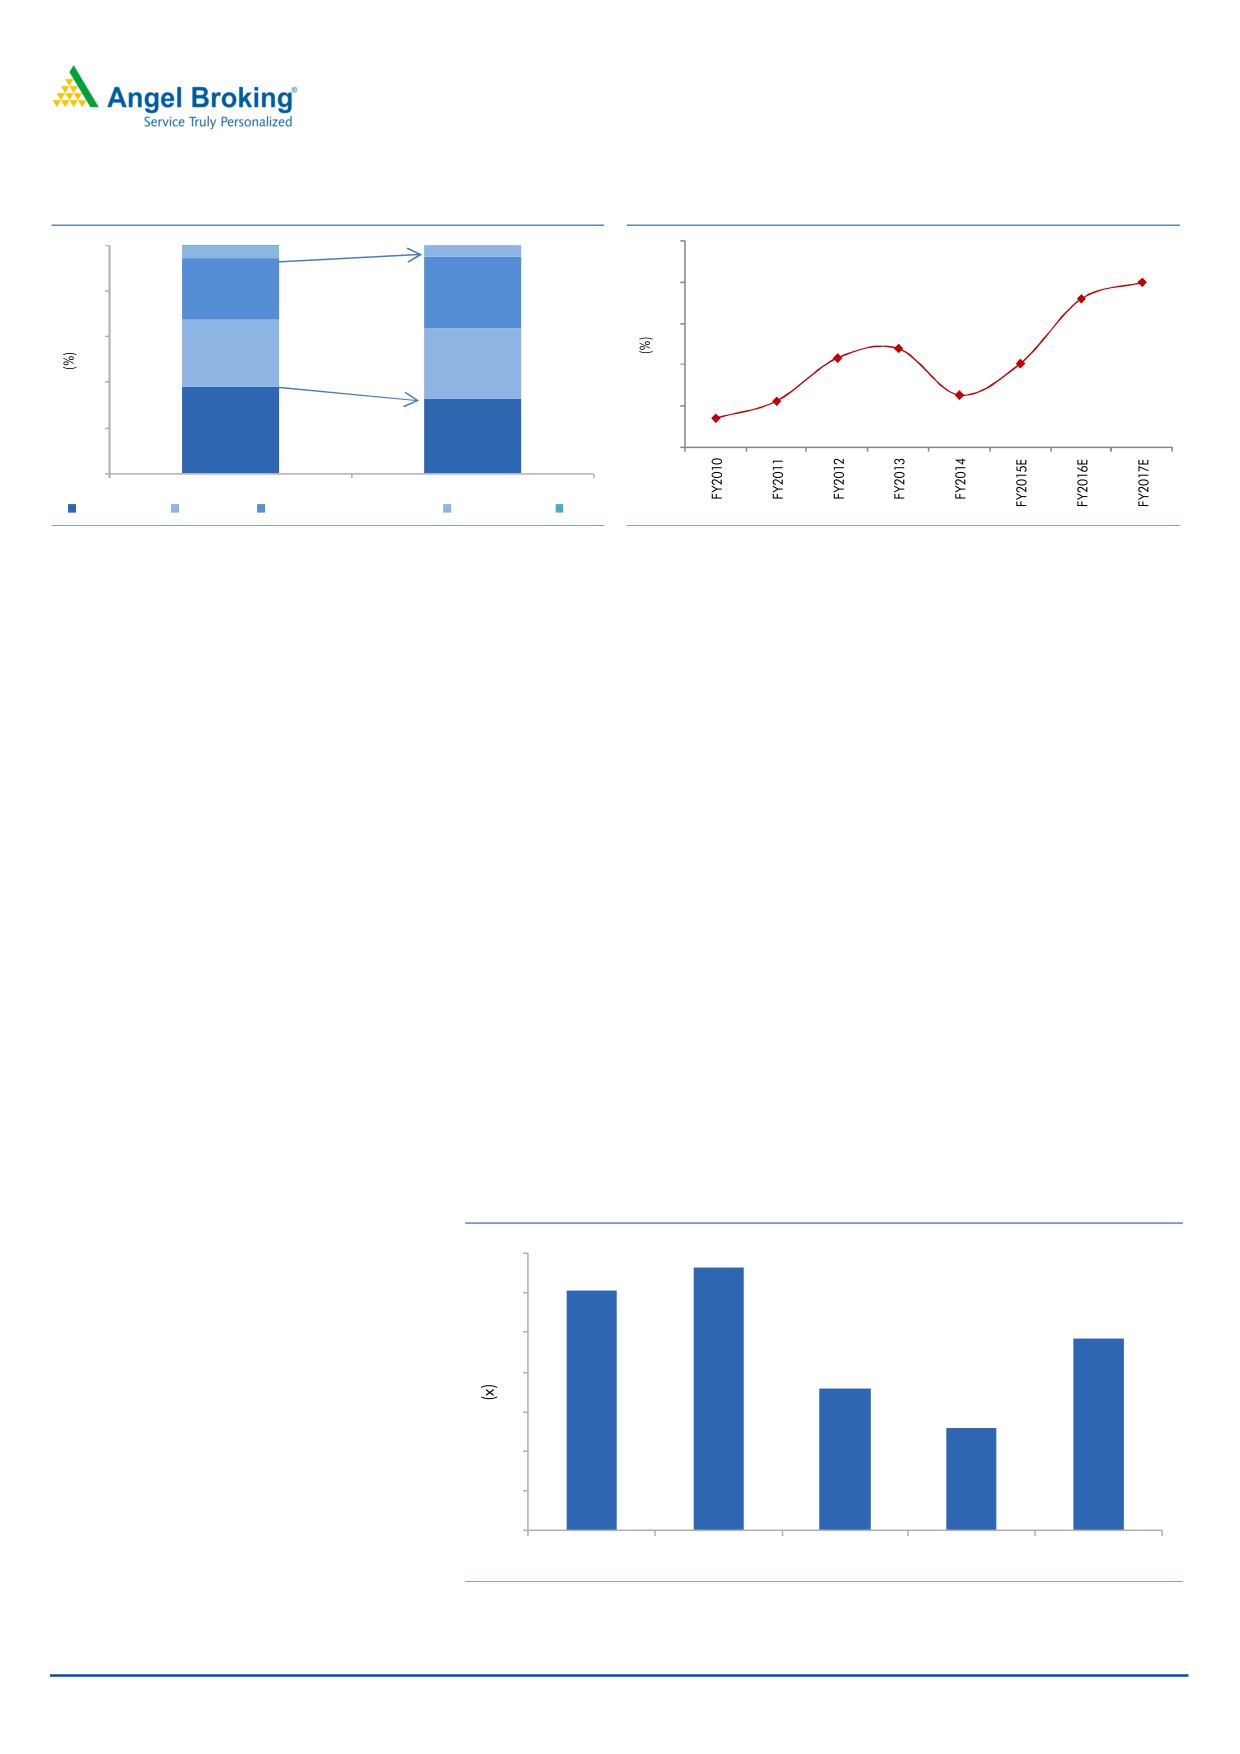
Exhibit 10: Sales tilt towards high margin business
Exhibit 11: Operating margins to expand
100
10
6
5
9.0
9
8.8
80
27
31
9
8.2
60
8.1
8.0
29
31
8
7.6
40
7.6
7.3
8
20
38
33
7
0
FY2014
FY2017E
Freight Division
XPS Division Supply Chain Solution Division Seaways Division Others
Source: Company, Angel Research
Source: Company, Angel Research
Hence, considering the above factors and with the company having reported
strong revenue growth for 9MFY2015 (coupled with margin improvement in some
of its divisions), we expect the company’s overall operating margin to improve
along with an improvement in the return ratio.
Well positioned due to its Asset light business model
TCIL operates on an asset light business model where it owns 20% of the total fleet
and leases the remaining 80%. The company has fastly scaled its business model
to 7,000 trucks/trailers/reefer vehicles as of today. On the same lines, TCIL has
been prudent in managing warehousing space, as a majority of its total 10mn sq ft
of warehousing space is on lease basis. With its focus to invest less on building the
asset base, the company has been able to generate healthy return ratios even in
the worst phases of business cycles. Given the company’s unlevered business
model, we are of the view that the long-term growth prospects of the company
would not be impacted due to lack of capital availability.
TCIL is one of the few companies in Surface Transportation & Logistics space,
which has consistency enjoyed a healthy asset turnover (FY2014 asset turnover
ratio at 5.2x) and ROE (FY2014 ROE at 14.6%). Given the strong matrices the
company displays, we are confident that TCIL at any phase of the business cycle
would be well positioned compared to its peers, which have majorly levered
business models and have lower ROEs.
Exhibit 12: Assets turnover ratio trend
5
5.2
5.1
5
5.0
5
5
4.9
5
4.8
5
5
5
FY2013
FY2014
FY2015E
FY2016E
FY2017E
Source: Company, Angel Research
February 21, 2015
7
Transport Corporation of India | Initiating Coverage
Outlook and Valuation
Going ahead, we expect TCIL to report a top-line CAGR of ~15% over FY2014-
We expect TCIL to report a top-line
17E to ~`3,350cr owing to recovery in sales growth. (a) The Freight division is
CAGR
of
~15%
over
expected to benefit due to improvement in industrial activities (b) The XPS Cargo
FY2014-17E to ~`3,350cr
division’s growth would be supported by growth in e- commerce (c) The Supply
Chain Solution division is expected to grow owing to recovery in the automobile
industry (more than 75% of the division’s revenue comes from the automobile
sector) and (d) The Seaways segment would benefit due to addition of new ships.
Also, improvement in the Indian economy would aid overall growth of the
company. Further, TCIL over the years has increased its presence across the
country. In a scenario, where GST gets rolled-out, we expect TCIL to be one of the
few pan-India based Logistics players to get benefitted from any such
development.
On the bottom-line front, we expect the company to report ~25% CAGR over
FY2014-17E on account of healthy top-line growth in the higher margin business
(change in revenue mix). Also we expect an operating margin improvement (60-
70bp) in the Freight segment due to pick up in volumes and lower fuel cost.
Further, TCIL operates on an asset light business model due to that company
would able to generate healthy return ratios even in the worst phases of business
cycles.
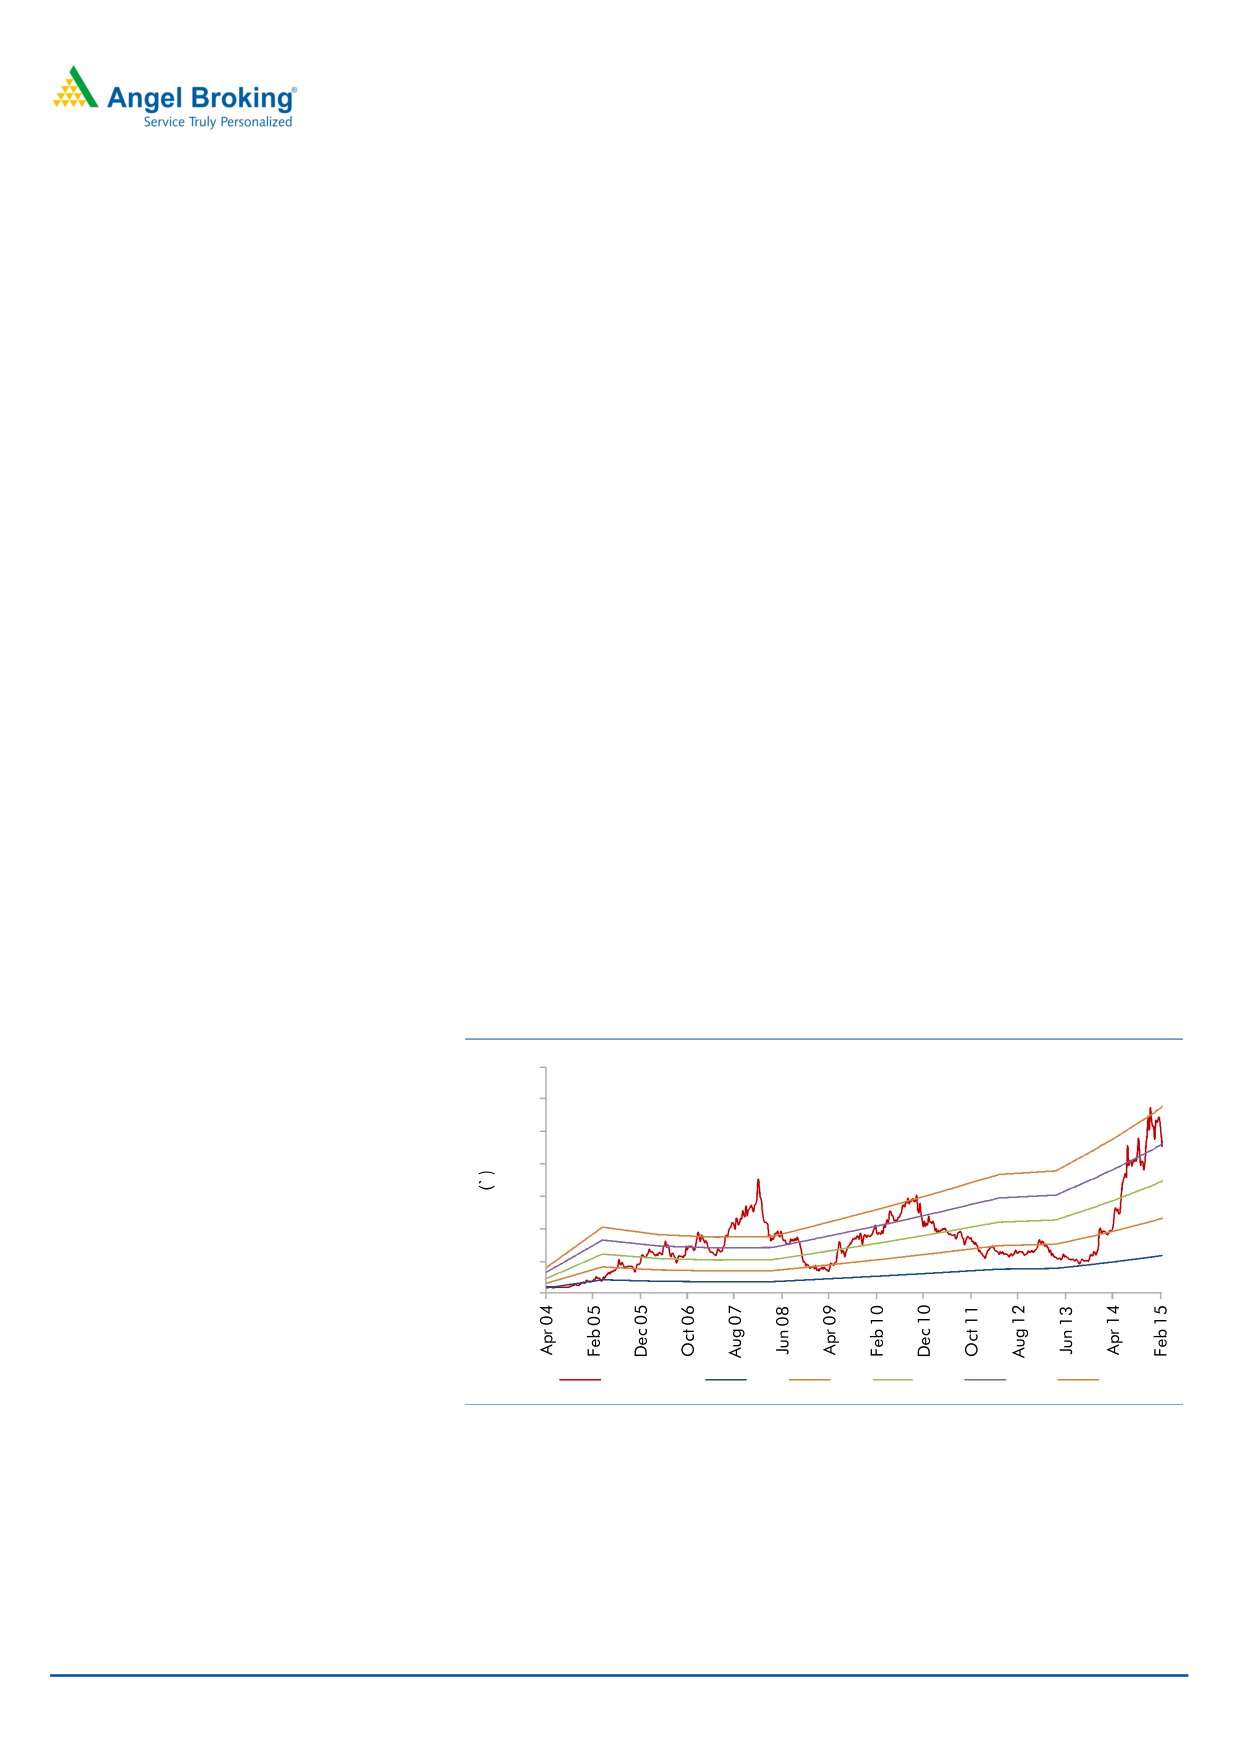
At the current market price of `250, the stock trades at a PE of 17.4x and 13.7x its
FY2016E and FY2017E EPS of `14.4 and `18.3, respectively. We initiate coverage
on the stock with a Buy recommendation and target price of `293, based on 16x
FY2017E EPS, indicating an upside of ~17% from the current levels.
Exhibit 13: One year forward PE chart band
350
300
250
200
150
100
50
0
Share Price
4x
8x
12x
16x
20x
Source: Company, Angel Research, Capitaline
February 21, 2015
8
Transport Corporation of India | Initiating Coverage
Exhibit 14: Comparative analysis
Company
Year end
Mcap
Sales
OPM PAT
EPS
RoE
P/E
P/BV
EV/ Sales
EV/ EBIDTA
TCIL
FY2015E
1,890
2,468
8.0
87
11.6
14.1
21.6
3.0
0.9
10.9
FY2016E
2,830
8.8
109
14.4
15.4
17.4
2.7
0.8
8.9
FY2017E
3,350
9.0
138
18.3
17.1
13.7
2.3
0.7
7.6
Gati
FY2015E
2,199
1,743
10.9
62
7.1
7.8
35.5
3.0
1.6
14.8
FY2016E
2,100
11.8
94
10.7
11.1
23.6
2.7
1.3
11.3
FY2017E
2,523
12.3
125
14.8
13.4
17.0
2.5
1.1
8.9
Source: Consensus, Angel Research
The downside risks to our estimates include 1) Increase in competition
would impact overall growth of the company, 2) Any increase in petrol and diesel
prices could negatively impact profitability (mainly in the Freight segment),
3) Delay in GST implementation would be a headwind for the industry’s growth
prospects, 4) Delay in plan capital expenditure in company’s segment could
hamper the company’s growth, and 5) lower-than-expected Indian economic
growth could affect company’s growth.
February 21, 2015
9
Transport Corporation of India | Initiating Coverage
Company Background
Transport Corporation of India Limited (TCI) is an integrated supply chain and
logistics solutions provider. The company operates in six business divisions: TCI
Freight, TCI XPS, TCI Supply Chain Solutions, TCI Seaways, TCI Global and TCI
Foundation. TCI Freight offers multimodal transport solutions for cargo of any
dimension. TCI XPS is a door-to-door express distribution specialist. TCI Supply
Chain Solutions provides supply chain solutions and services right from
conceptualization to implementation. TCI Seaways caters to the costal cargo
requirements for transporting container and bulk cargo from parts on the east
coast of India to Port Blair in the Andaman and Nicobar Islands and further
distribution within the islands. TCI Global provides a single window advantage to
its customer across all South East Asian countries.
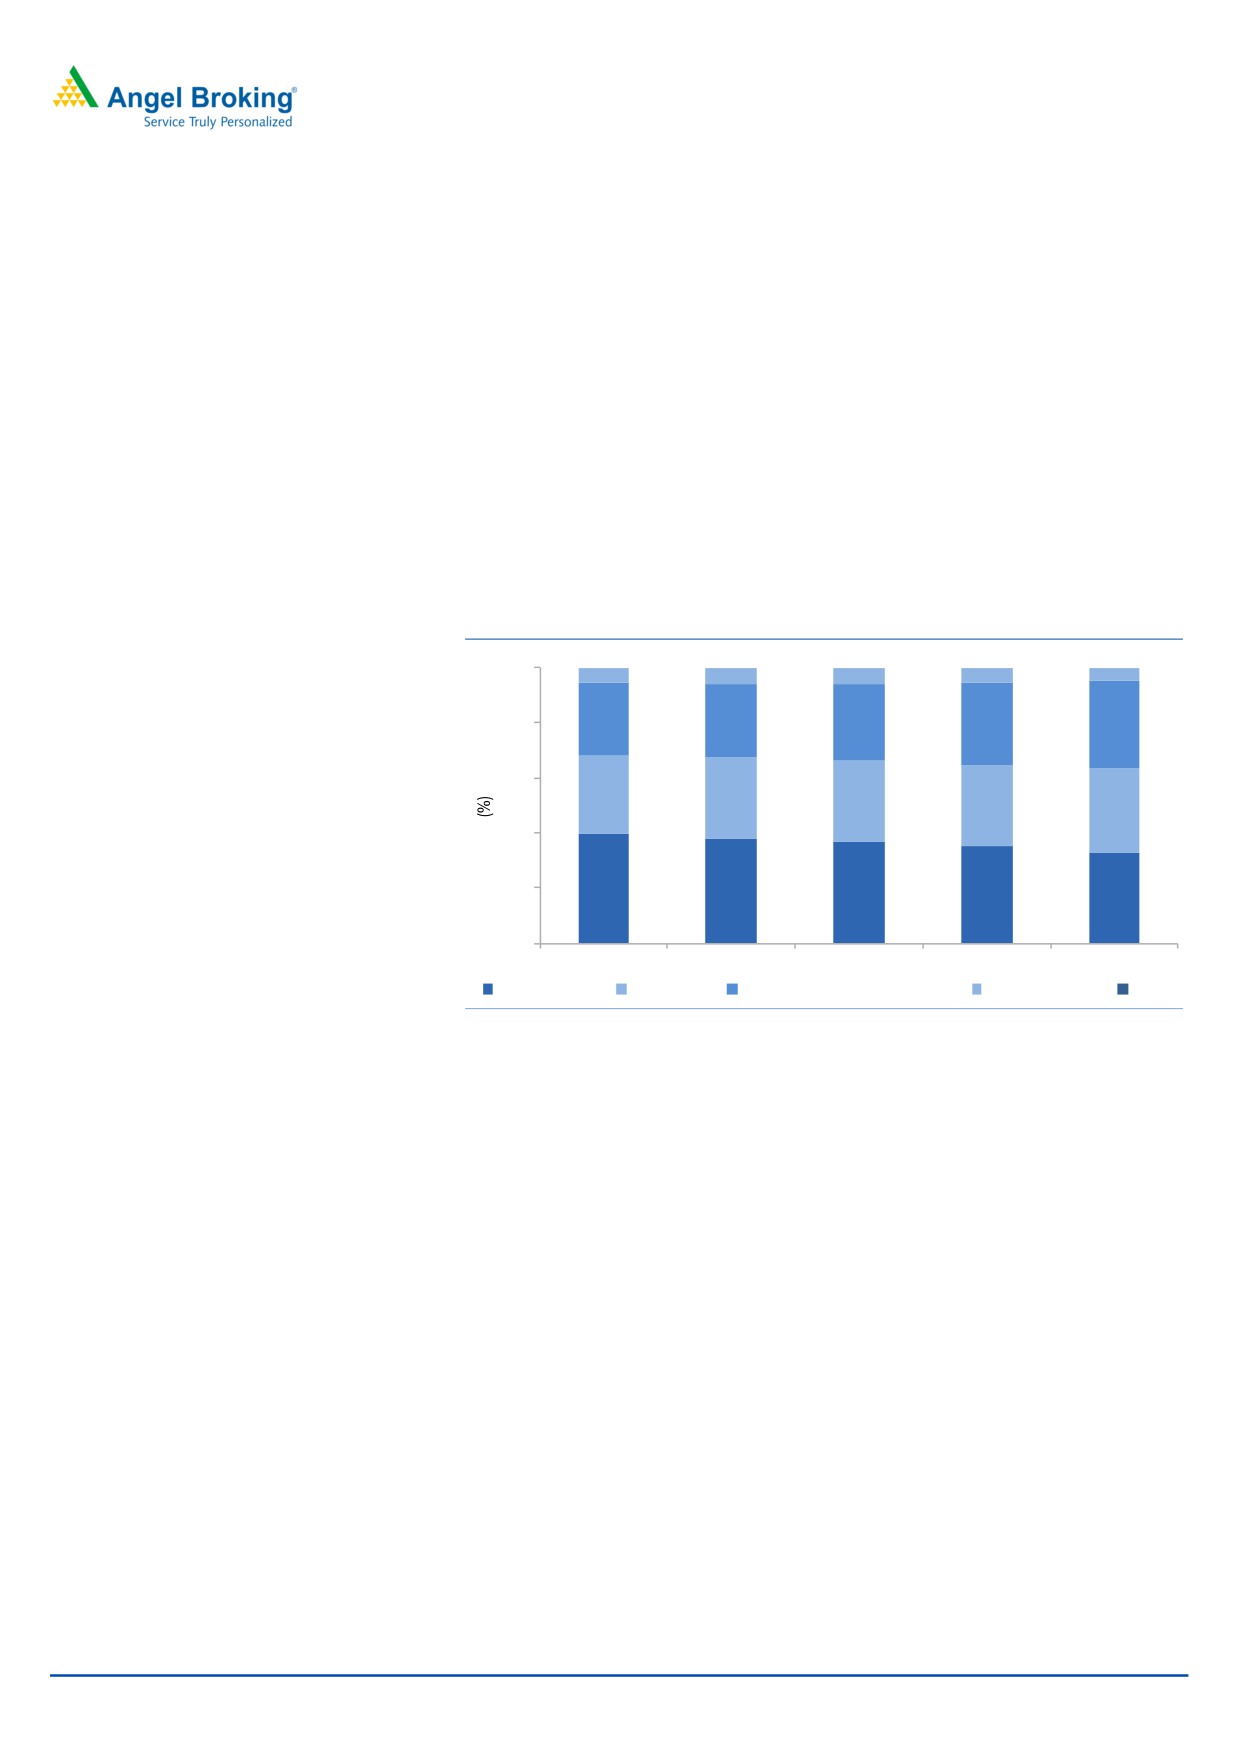
Exhibit 15: Revenue mix
0
0
0
0
0
100
5
6
5
5
5
80
27
27
28
30
31
60
28
29
29
30
31
40
20
40
38
37
35
33
0
FY2013
FY2014
FY2015E
FY2016E
FY2017E
Freight Division XPS Division Supply Chain Solution Division Seaways Division Others
Source: Company, Angel Research
February 21, 2015
10
Transport Corporation of India | Initiating Coverage
Financial outlook
Top-line likely to clock a CAGR of ~15% over FY2014-17E
Going forward, we expect TCIL to
TCIL has reported a consolidated sales CAGR of ~6% over FY2011-14. During
register healthy consolidated top-line
FY2014, the company was unable to perform well due to slowdown in Indian
CAGR of ~15% over FY2014-17E
economy which impacted the overall Freight and XPS segments. Going forward,
we expect TCI to register a healthy net sales CAGR of ~15% over FY2014-17E
supported by healthy sales growth in Freight, XPS, Supply Chain Solution and Ship-
TCISW segments on back of recovery in the Indian economy. Further, we expect
implementation of GST in CY2016 to also boost growth of logistic companies like
TCIL. Hence, we expect TCIL’s net sales to grow by ~15% yoy and ~18% yoy in
FY2016 and FY2017, respectively.
Exhibit 16: Projected Net Sales growth trend
4,000
18.4
20
18
3,500
14.6
16
3,000
14
2,500
10.8
12
9.0
2,000
10
8
1,500
5.5
4.5
6
1,000
4
500
2
-
0
FY2012
FY2013
FY2014
FY2015E FY2016E FY2017E
Net Revenue
yoy growth (%)
Source: Company, Angel Research
Consolidated EBITDA to witness a CAGR of ~21% over FY2014-17E
Going forward, we expect the
Going forward, we expect the company’s operating margin to be improve from
company’s consolidated EBITDA margin
8% to 9% owing to higher contribution of higher margin businesses like XPS Cargo
to be in the range of 8.0-9.0%
and Supply Chain Solution in total revenue and improvement in utilization.
Exhibit 17: Projected EBIDTA and margin trend
350
10
9.0
300
8.8
9
250
8.2
9
8.1
8.0
200
8
7.6
150
8
100
7
50
0
7
FY2012
FY2013
FY2014
FY2015E FY2016E FY2017E
EBITDA
Margin (%)
Source: Company, Angel Research
February 21, 2015
11
Transport Corporation of India | Initiating Coverage
Company to report healthy consolidated growth
We expect ~25% CAGR in consolidated
We expect the company to post ~25% CAGR in net profit over FY2014-17E,
Net Profit over FY2014-17E
mainly led by strong revenue growth and improvement in margin.
Exhibit 18: Projected Net Profit growth trend
160
27.4
30
24.3
140
22.1
25
120
18.7
16.8
20
100
80
15
60
10
40
3.0
5
20
0
0
FY2012
FY2013
FY2014
FY2015E FY2016E FY2017E
Net Profit
yoy growth (%)
Source: Company, Angel Research
Return ratios expected to bounce back
We expect the company to report improvement in its ROE and ROCE on the back
of healthy profitability with strong sales, healthy operating margin due to better
revenue segment mix, and higher utilization. In our view, the company is likely to
report a ROE of 14.6% to 17.1%and ROCE of 14.9% to 18.0% between FY2014 to
FY2017.
Exhibit 19: Improving ROE & ROCE
19
18
17
16
15
14
13
FY2012
FY2013
FY2014
FY2015E FY2016E FY2017E
ROE
ROCE
Source: Company, Angel Research
February 21, 2015
12
Transport Corporation of India | Initiating Coverage
Consolidated Profit & Loss Statement
Y/E March (` cr)
FY2013
FY2014
FY2015E
FY2016E
FY2017E
Total operating income
2,132
2,228
2,468
2,830
3,350
% chg
9.0
4.5
10.8
14.6
18.4
Total Expenditure
1,957
2,058
2,271
2,581
3,049
Personnel Expenses
112
117
133
156
188
Others Expenses
1,845
1,941
2,137
2,425
2,861
EBITDA
175
170
198
249
302
% chg
10.6
(2.7)
16.3
25.9
21.1
(% of Net Sales)
8.2
7.6
8.0
8.8
9.0
Depreciation & Amortisation
46
47
54
63
73
EBIT
128
123
144
186
228
% chg
10.3
(4.0)
17.1
28.7
23.0
(% of Net Sales)
6.0
5.5
5.8
6.6
6.8
Interest & other Charges
34
31
33
36
38
Other Income
6
7
10
6
8
(% of PBT)
6.3
7.2
8.2
3.7
3.8
Share in profit of Associates
-
-
-
-
-
Recurring PBT
101
99
122
155
198
% chg
18.1
(1.8)
22.6
27.8
27.4
Prior Period & Extra. Exp./(Inc.)
-
-
-
-
-
PBT (reported)
101
99
122
155
198
Tax
32
27
34
47
59
(% of PBT)
31.2
27.7
28.0
30.0
30.0
PAT (reported)
70
72
88
109
139
Add: Share of earnings of asso.
-
-
-
-
-
Less: Minority interest (MI)
0
0
0
0
0
PAT after MI (reported)
70
72
87
109
138
ADJ. PAT
70
72
87
109
138
% chg
16.8
3.0
22.1
24.3
27.4
(% of Net Sales)
3.3
3.2
3.5
3.8
4.1
Basic EPS (`)
9.2
9.5
11.6
14.4
18.3
Fully Diluted EPS (`)
9.2
9.5
11.6
14.4
18.3
% chg
16.8
3.0
22.1
24.3
27.4
February 21, 2015
13
Transport Corporation of India | Initiating Coverage
Consolidated Balance sheet
Y/E March (` cr)
FY2013
FY2014
FY2015E FY2016E FY2017E
SOURCES OF FUNDS
Equity Share Capital
15
15
15
15
15
Reserves& Surplus
422
476
606
691
796
Shareholders Funds
437
491
621
706
811
Minority Interest
1
3
3
3
3
Total Loans
354
336
395
430
460
Deferred Tax Liability
32
33
33
33
33
Total Liabilities
824
863
1,052
1,172
1,307
APPLICATION OF FUNDS
Gross Block
652
693
823
973
1,123
Less: Acc. Depreciation
234
262
315
378
451
Net Block
418
432
508
595
672
Capital Work-in-Progress
5
18
18
18
18
Investments
8
8
8
8
8
Current Assets
534
543
677
731
828
Inventories
2
2
2
2
2
Sundry Debtors
395
380
419
481
569
Cash
46
43
120
85
53
Loans & Advances
67
65
74
91
114
Other Assets
24
53
62
74
90
Current liabilities
141
138
159
181
218
Net Current Assets
393
405
518
551
609
Mis. Exp. not written off
-
-
-
-
-
Total Assets
824
863
1,052
1,172
1,307
February 21, 2015
14
Transport Corporation of India | Initiating Coverage
Consolidated Cash flow
Y/E March (` cr)
FY2013
FY2014
FY2015E FY2016E FY2017E
Profit before tax
101
99
122
155
198
Depreciation
46
47
54
63
73
Change in Working Capital
(46)
15
(35)
(69)
(91)
Interest / Dividend (Net)
29
25
33
36
38
Direct taxes paid
(26)
(28)
(34)
(47)
(59)
Others
0
0
0
0
0
Cash Flow from Operations
104
158
138
140
159
(Inc.)/ Dec. in Fixed Assets
(55)
(98)
(130)
(150)
(150)
(Inc.)/ Dec. in Investments
(6)
-
-
-
-
Cash Flow from Investing
(61)
(98)
(130)
(150)
(150)
Issue of Equity
1
1
60
0
0
Inc./(Dec.) in loans
13
(19)
60
35
30
Dividend Paid (Incl. Tax)
(8)
(12)
(17)
(24)
(33)
Interest / Dividend (Net)
(35)
(33)
(33)
(36)
(38)
Cash Flow from Financing
(28)
(63)
69
(25)
(41)
Inc./(Dec.) in Cash
15
(3)
78
(35)
(32)
Opening Cash balances
31
46
43
120
85
Closing Cash balances
46
43
120
85
53
February 21, 2015
15
Transport Corporation of India | Initiating Coverage
Key Ratios
Y/E March
FY2013
FY2014
FY2015E
FY2016E
FY2017E
Valuation Ratio (x)
P/E (on FDEPS)
27.2
26.4
21.6
17.4
13.7
P/CEPS
16.3
15.9
13.4
11.0
8.9
P/BV
4.3
3.9
3.0
2.7
2.3
Dividend yield (%)
0.6
0.7
0.9
1.3
1.8
EV/Sales
1.0
1.0
0.9
0.8
0.7
EV/EBITDA
12.5
12.8
10.9
8.9
7.6
EV / Total Assets
2.3
2.2
1.8
1.6
1.5
Per Share Data (`)
EPS (Basic)
9.2
9.5
11.6
14.4
18.3
EPS (fully diluted)
9.2
9.5
11.6
14.4
18.3
Cash EPS
15.3
15.7
18.7
22.7
28.0
DPS
1.5
1.8
2.3
3.2
4.4
Book Value
57.8
64.9
82.1
93.3
107.2
Returns (%)
ROCE
16.2
14.9
14.2
16.4
18.0
Angel ROIC (Pre-tax)
17.4
15.9
16.3
17.8
18.9
ROE
15.9
14.6
14.1
15.4
17.1
Turnover ratios (x)
Asset Turnover (Gross Block)
5.1
5.2
4.9
4.8
5.0
Inventory / Sales (days)
0
0
0
0
0
Receivables (days)
68
62
62
62
62
Payables (days)
15
13
13
12
12
WC cycle (days)
53
50
49
50
50
Solvency ratios (x)
Net debt to equity
0.7
0.6
0.4
0.5
0.5
Net debt to EBITDA
1.7
1.7
1.3
1.5
1.4
Interest Coverage (EBIT / Int.)
3.8
4.0
4.4
4.8
5.7
February 21, 2015
16
Transport Corporation of India | Initiating Coverage
Research Team Tel: 022 - 39357800
DISCLAIMER
This document is solely for the personal information of the recipient, and must not be singularly used as the basis of any investment
decision. Nothing in this document should be construed as investment or financial advice. Each recipient of this document should
make such investigations as they deem necessary to arrive at an independent evaluation of an investment in the securities of the
companies referred to in this document (including the merits and risks involved), and should consult their own advisors to determine
the merits and risks of such an investment.
Angel Broking Pvt. Limited, its affiliates, directors, its proprietary trading and investment businesses may, from time to time, make
investment decisions that are inconsistent with or contradictory to the recommendations expressed herein. The views contained in this
document are those of the analyst, and the company may or may not subscribe to all the views expressed within.
Reports based on technical and derivative analysis center on studying charts of a stock's price movement, outstanding positions and
trading volume, as opposed to focusing on a company's fundamentals and, as such, may not match with a report on a company's
fundamentals.
The information in this document has been printed on the basis of publicly available information, internal data and other reliable
sources believed to be true, but we do not represent that it is accurate or complete and it should not be relied on as such, as this
document is for general guidance only. Angel Broking Pvt. Limited or any of its affiliates/ group companies shall not be in any way
responsible for any loss or damage that may arise to any person from any inadvertent error in the information contained in this report.
Angel Broking Pvt. Limited has not independently verified all the information contained within this document. Accordingly, we cannot
testify, nor make any representation or warranty, express or implied, to the accuracy, contents or data contained within this document.
While Angel Broking Pvt. Limited endeavours to update on a reasonable basis the information discussed in this material, there may be
regulatory, compliance, or other reasons that prevent us from doing so.
This document is being supplied to you solely for your information, and its contents, information or data may not be reproduced,
redistributed or passed on, directly or indirectly.
Angel Broking Pvt. Limited and its affiliates may seek to provide or have engaged in providing corporate finance, investment banking
or other advisory services in a merger or specific transaction to the companies referred to in this report, as on the date of this report or
in the past.
Neither Angel Broking Pvt. Limited, nor its directors, employees or affiliates shall be liable for any loss or damage that may arise from
or in connection with the use of this information.
Note: Please refer to the important `Stock Holding Disclosure' report on the Angel website (Research Section). Also, please refer to the
latest update on respective stocks for the disclosure status in respect of those stocks. Angel Broking Pvt. Limited and its affiliates may
have investment positions in the stocks recommended in this report.
Disclosure of Interest Statement
Transport Corporation of India
1. Analyst ownership of the stock
No
2. Angel and its Group companies ownership of the stock
No
3. Angel and its Group companies' Directors ownership of the stock
No
4. Broking relationship with company covered
No
Note: We have not considered any Exposure below ` 1 lakh for Angel, its Group companies and Directors
Ratings (Based on expected returns
Buy (> 15%)
Accumulate (5% to 15%)
Neutral (-5 to 5%)
over 12 months investment period):
Reduce (-5% to -15%)
Sell (< -15%)
February 21, 2015
17
Transport Corporation of India | Initiating Coverage
6th Floor, Ackruti Star, Central Road, MIDC, Andheri (E), Mumbai- 400 093. Tel: (022) 39357800
Research Team
Fundamental:
Sarabjit Kour Nangra
VP-Research, Pharmaceutical
Vaibhav Agrawal
VP-Research (Banking)
Amarjeet Maurya
Analyst (FMCG, Media, Mid-Cap)
Bharat Gianani
Analyst (Automobile, Auto Ancillary)
Rahul Dholam
Analyst (Metal, Oil & Gas)
Santosh Yellapu
Analyst (Infrastructure)
Shrenik Gujrathi
Analyst (Cap Goods, Cement)
Umesh Matkar
Analyst (Banking)
Twinkle Gosar
Analyst (Mid-Cap)
Neha Sinha
Economist
Tejas Vahalia
Research Editor
Technicals and Derivatives:
Siddarth Bhamre
Head - Technical & Derivatives
Sameet Chavan
Technical Analyst
Sneha Seth
Associate (Derivatives)
Institutional Sales Team:
Mayuresh Joshi
VP - Institutional Sales
Meenakshi Chavan
Dealer
Gaurang Tisani
Assistant Manager
Production Team:
Dilip Patel
Production Incharge
CSO & Registered Office: G-1, Ackruti Trade Centre, Road No. 7, MIDC, Andheri (E), Mumbai - 93. Tel: (022) 3083 7700. Angel Broking Pvt. Ltd: BSE Cash: INB010996539 / BSE F&O: INF010996539, CDSL Regn. No.: IN - DP - CDSL - 234 - 2004, PMS Regn. Code: PM/INP000001546, NSE Cash: INB231279838 /
NSE F&O: INF231279838 / NSE Currency: INE231279838, MCX Stock Exchange Ltd: INE261279838 / Member ID: 10500. Angel Commodities Broking (P) Ltd.: MCX Member ID: 12685 / FMC Regn. No.: MCX / TCM / CORP / 0037 NCDEX: Member ID 00220 / FMC Regn. No.: NCDEX / TCM / CORP / 0302.
February 21, 2015
18